Uploading demo logs and analyzing Firewall logs
Summary: In this blog, we are going to download demo logs from GitHub and upload, understand and analyze FortiGate and Palo alto raw logs.
Uploading logs to Splunk :
We will start by downloading the dataset from https://github.com/splunk/botsv1 this site. Here in the below pic, you can see two different datasets ( One containing normal and attack logs and the other one containing only attack logs).
I am downloading the attack logs.
This dataset contains different types of logs as shown below. As the botsv1 dataset contains only FortiGate firewall logs for Palo Alto logs we will download the botsv2 dataset from this site https://github.com/splunk/botsv2
Uploading logs to Splunk:
After downloading both the datasets, extract and copy both the folders and paste them to InstallationPath/Splunk/etc/apps
Understanding Firewall logs:
There are three types of logging formats in a firewall
- Traffic logs: In this logging format all the traffic logs are saved such as traffic coming and out of the firewall.
- System logs: In this logging format all the actions that we take are recorded such as logging in/out of the firewall, rules modification, and configuration changes.
- Threat logs: In NGFW we find application level threats recorded in this logging format.
In the picture below we can see the three logging formats of our firewall in Splunk.
Important fields in Firewall logs:
Before starting to read raw firewall logs we will note the important fields in the firewalls.
- Date & Time
- source IP
- NAT SourceIP
- Source port
- Source Interface/Zone
- Destination IP
- Nat Destination IP
- Destination Port
- Destination Interface/Zone
- Rule Name
- Action
- Total Bytes
- Bytes sent
- Bytes received
- Source country
- Destination country
Palo Alto firewall: Understanding raw logs
Step1: We will select one raw log and copy it into a notepad and break the log into each field.
Step2: Write what we feel that field notifies what we don't know yet we will keep that empty for now.
Step2: Write what we feel that field notifies what we don't know yet we will keep that empty for now.
PS: To know what the remaining fields are we can directly enter the value in Splunk and find out.
Ex: From the above picture field= 2236801
We can see that it is the sequence number of the packet.
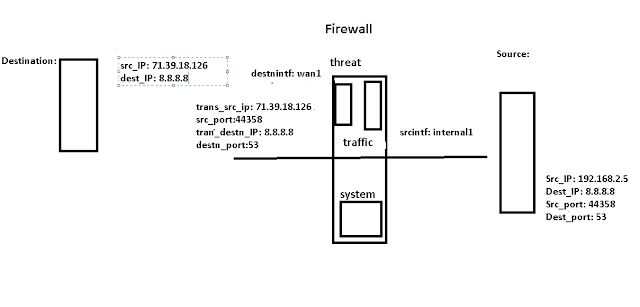
Traffic Diagram:
Fortigate firewall: Understanding raw logs
We will follow the same steps to analyze FortiGate logs. It is pre-defined in FortiGate logs we can read and get an idea of how the traffic is flowing.


Comments
Post a Comment